Aims of the course
The aim of the course is to familiarise students with current areas of research and development within computer science that have a direct relevance to the field of journalism, so that they are capable of participating in the design of future public information systems.
The course is built around a “design” frame that examines technology from the point of view of its possible applications and social context. It will familiarize the students with both the major unsolved problems of internet-era journalism, and the major areas of research within computer science that are being brought to bear on these problems. The scope is wide enough to include both relatively traditional journalistic work, such as computer-assisted investigative reporting, and the broader information systems that we all use every day to inform ourselves, such as search engines. The course will provide students with a thorough understanding of how particular fields of computational research relate to products being developed for journalism, and provoke ideas for their own research and projects.
Research-level computer science material will be discussed in class, but the emphasis will be on understanding the capabilities and limitations of this technology. Students with a CS background will have opportunity for algorithmic exploration and innovation, however the primary goal of the course is thoughtful, application-centered research and design.
Assignments will be completed in groups and involve experimentation with fundamental computational techniques. There will be some light coding, but the emphasis will be on thoughtful and critical analysis.
Format of the class, grading and assignments.
It is a fourteen week course for Masters’ students which has both a six point and a three point version. The six point version is designed for dual degree candidates in the journalism and computer science concentration, while the three point version is designed for those cross listing from other concentrations and schools.
The class is conducted in a seminar format. Assigned readings and computational techniques will form the basis of class discussion. Throughout the semester we will be inviting guest speakers with expertise in the relevant areas to talk about their related research and product development
The output of the course for a 6pt candidate will be one research assignment in the form of a 25-page research paper. The three point course will require a shorter research paper, and both versions of the course will also have approximately bi-weekly written assignmenst which will frequently involve experimentation with computational techniques. For those in the dual degree program or who have strong technical skills, there is an option to produce a prototype as part of the final assignment. The class is conducted on pass/fail basis for grading, in line with the journalism school’s grading system.
Week 1. – Basics
We set out the expectations of the course, and frame our work as the task of designing of public information production and distribution systems. Computer science techniques can help in four different areas: data-driven reporting, story presentation, information filtering, and effect tracking. The recommended readings are aiming to to give you an understanding of the landscape of technical disruption in the news industry, and the ways in which computer science techniques can help to build something better.
Required
- What should the digital public sphere do?, Jonathan Stray
- Dilemmas in a General Theory of Planning, Horst Rittel, Melvin Weber
Recommended
- Newspapers and thinking the Unthinkable, Clay Shirky
- Computational Journalism, Cohen, Turner, Hamilton,
- Precision Journalism, Ch.1, Journalism and the Scientific Tradition, Philip Meyer
Viewed in class
- The Jobless rate for People Like You, New York Times
- Dollars for Docs, ProPublica
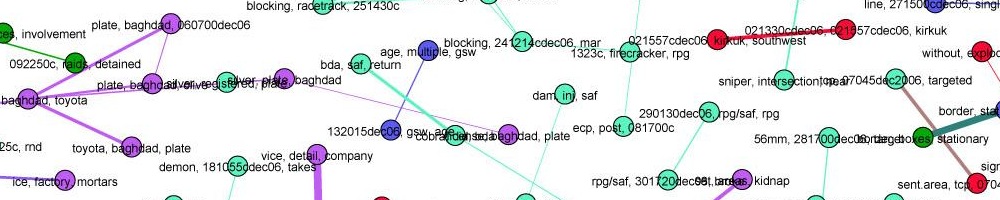
- What did private security contractors do in Iraq and document mining methodology, Jonathan Stray
- The network of global corporate control, Vitali et. al.
- World Government Data, The Guardian UK
- NICAR journalism database library
Weeks 2-3: Technical fundamentals
We’ll spend the next couple weeks examining the techniques that will form the basis of much of the rest of our work in the course: clustering and the document vector space model.
Week 2: Clustering
A vector of numbers is a fundamental data representation which forms the basis of very many algorithms in data mining, language processing, machine learning, and visualization. This week we will explore two things: representing objects as vectors, and clustering them, which might be the most basic thing you can do with this sort of data. This requires a distance metric and a clustering algorithm — both of which involve editorial choices! In journalism we can use clusters to find groups of similar documents, analyze how politicians vote together, or automatically detect groups of crimes.
Required
- Cluster Analysis, Wikipedia
- General purpose computer-assisted clustering and conceptualization, Justin Grimmer, Gary King
Recommended
- ‘GOP 5’ make strange bedfellows in budget fight, Chase Davis, California Watch
- The Challenges of Clustering High Dimensional Data, Steinbach, Ertöz, Kumar
- Survey of clustering data mining techniques, Pavel Berkhin
Viewed in class
- Message Machine, ProPublica
- Data mining in politics, Aleks Jakulin
- A House Divided, Delaware Online
Assignment: you must choose your groups of 2-3 students, and pick a data set to work with for the rest of the course. Due next week.
Week 3: Document topic modelling
The text processing algorithms we will discuss this week are used in just about everything: search engines, document set visualization, figuring out when two different articles are about the same story, finding trending topics. The vector space document model is fundamental to algorithmic handling of news content, and we will need it to understand how just about every filtering and personalization system works.
Required
- Online Natural Language Processing Course, Stanford University
- Week 7: Information Retrieval, Term-Document Incidence Matrix
- Week 7: Ranked Information Retrieval, Introducing Ranked Retrieval
- Week 7: Ranked Information Retrieval, Term Frequency Weighting
- Week 7: Ranked Information Retrieval, Inverse Document Frequency Weighting
- Week 7: Ranked Information Retrieval, TF-IDF weighting
- Probabilistic Topic Models, David M. Blei
Recommended:
- A full-text visualization of the Iraq war logs, Jonathan Stray
- Latent Semantic Analysis, Peter Wiemer-Hastings
- Probabilistic Latent Semantic Indexing, Hofmann
- Introduction to Information Retrieval Chapter 6, Scoring, Term Weighting, and The Vector Space Model, Manning, Raghavan, and Schütze.
Assignment – due in three weeks
You will perform document clustering with the gensim Python library, and analyze the results.
- Choose a document set. You can use the Reuters corpus if you like but you are encouraged to try other sources.
- Import the documents and score them in TF-IDF form. Then query the document set by retrieving the top ten closest documents (as ranked by cosine distance) for a variety different queries. Choose three different queries that show interesting strengths and weaknesses of this approach, and write analysis of the results.
- Choose a topic modelling method (such as connected components, LSA, or LDA) and cluster your documents. Hand in the extracted topics and comment on the results.
- Choose a clustering method (such as k-means) and cluster the documents based on the extracted topics. How do the resulting clusters compare to how a human might categorize the documents
Weeks 4-5: Filtering
Over the next few weeks we will explore various types of collaborative filters: social, algorithmic, hybrid classic correlation-based filtering algorithms (“users who bought X also bought Y”, Netflix Prize) location- and context-based filtering. Our study will include the technical fundamentals of clustering and recommendation algorithms.
Week 4: Information overload and algorithmic filtering
This week we begin our study of filtering with some basic ideas about its role in journalism. Then we shift gears to pure algorithmic approaches to filtering, with a look at how the Newsblaster system works (similar to Google News.)
Required
- Who should see what when? Three design principles for personalized news Jonathan Stray
- Tracking and summarizing news on a daily basis with Columbia Newsblaster, McKeown et al
Recommended
- Guess what? Automated news doesn’t quite work, Gabe Rivera
- The Hermeneutics of Screwing Around, or What You Do With a Million Books, Stephen Ramsay
- Can an algorithm be wrong?, Tarleton Gillespie
- The Netflix Prize, Wikipedia
Week 5: Social software and social filtering
We have now studied purely algorithmic modes of filtering, and this week we will bring in the social. First we’ll look at the entire concept of “social software,” which is a new interdisciplinary field with its own dynamics. We’ll use the metaphor of “architecture,” suggested by Joel Spolsky, to think about how software influences behaviour. Then we’ll study social media and its role in journalism, including its role in information distribution and collection, and emerging techniques to help find sources.
Required
- A Group is its own worst enemy, Clay Shirky
- What’s the point of social news?, Jonathan Stray
- Finding and Assessing Social Information Sources in the Context of Journalism, Nick Diakopolous et al.
Recommended
- Learning from Stackoverflow, first fifteen minutes, Joel Spolsky
- Norms, Laws, and Code, Jonathan Stray
- What is Twitter, a Social Network or a News Media?, Haewoon Kwak, et al,
- International reporting in the age of participatory media, Ethan Zuckerman
- We The Media. Introduction and Chapter 1, Dan Gillmor,
- Are we stuck in filter bubbles? Here are five potential paths out, Jonathan Stray
Week 6: Hybrid filters, recommendation, and conversation
We have now studied purely algorithmic and mostly social modes of filtering. This week we’re going to study systems that combine software and people. We’ll a look “recommendation” systems and the socially-driven algorithms behind them. Then we’ll turn to online discussions, and hybrid techniques for ensuring a “good conversation” — a social outcome with no single definition. We’ll finish by looking at an example of using human preferences to drive machine learning algorithms: Google Web search.
Required
- Item-Based Collaborative Filtering Recommendation Algorithms, Sarwar et. al
- How Reddit Ranking Algorithms Work, Amir Salihefendic
Recommended
- Google News Personalization: Scalable Online Collaborative Filtering, Das et al
- Slashdot Moderation, Rob Malda
- Pay attention to what Nick Denton is doing with comments, Clay Shirky
- How does Google use human raters in web search?, Matt Cutts
Assignment – due in two weeks:
Design a filtering algorithm for Facebook status updates. The filtering function will be of the form(status update, user data) => boolean. That is, given all previously collected user data and a new status update from a friend, you must decide whether or not to show the new update in the user’s news feed. Turn in a design document with the following items:
- List all available information that Facebook has about you. Include a description of how this information is collected or changes over time.
- Argue for the factors that you would like to influence the filtering, both in terms of properties that are desirable to the user and properties that are desirable socially. Specify as concretely as possible how each of these (probably conflicting) goals might be implemented in code.
- Write psuedo-code for the filter function. It does not need to be executable and may omit details, however it must be specific enough that a competent programmer can turn it into working code in an obvious way.
Weeks 7-9: Knowledge mining
Week 7: Visualization
An introduction into how visualisation helps people interpret information. The difference between infographics and visualization, and between exploration and presentation. Design principles from user experience considerations, graphic design, and the study of the human visual system. Also, what is specific about visualization in journalism, as opposed to the many other fields that use it?
Required
- Designing Data Visualizations, Noah Illinsky and Julie Steele, OReilly
- Computational Information Design chapters 1 and 2, Ben Fry
Recommended
- Journalism in an age of data, Geoff McGhee
- Visualization Rhetoric: Framing Effects in Narrative Visualization, Hullman and Diakopolous
- Visualization, Tamara Munzner
Week 8: Structured journalism and knowledge representation
Is journalism in the text/video/audio business, or is it in the knowledge business? This week we’ll look at this question in detail, which gets us deep into the issue of how knowledge is represented in a computer. The traditional relational database model is often inappropriate for journalistic work, so we’re going to concentrate on so-called “linked data” representations. Such representations are widely used and increasingly popular. For example Google recently released the Knowledge Graph. But generating this kind of data from unstructured text is still very tricky, as we’ll see when we look at th Reverb algorithm.
Required
- A fundamental way newspaper websites need to change, Adrian Holovaty
- The next web of open, linked data – Tim Berners-Lee TED talk
- Identifying Relations for Open Information Extraction, Fader, Soderland, and Etzioni (Reverb algorithm)
Recommended
- Standards-based journalism in a semantic economy, Xark
- What the semantic web can represent – Tim Berners-Lee
- Building Watson: an overview of the DeepQA project
- Can an algorithm write a better story than a reporter? Wired/ 2012.
Assignment: Use Reverb to extract propositions from a subset of your data set (if applicable, otherwise the Reuters corpus). Analyze the results. What types of propositions are extracted? What types of propositions are not? Does it depend on the wording of the original text? What mistakes does Reverb make? What is the error rate? Are there different error rates for different types of statements, sources, or other categories?
Week 9: Network analysis
add intelligence examples?
Network analysis (aka social network analysis, link analysis) is a promising and popular technique for uncovering relationships between diverse individuals and organizations. It is widely used in intelligence and law enforcement, but not so much in journalism. We’ll look at basic techniques and algorithms and try to understand the promise — and the many practical problems.
Required
- Analyzing the Data Behind Skin and Bone, ICIJ
- Sections I and II of Community Detection in Graphs, Fortunato
- Centrality and Network Flow, Borgatti
Recommended
- Visualizing Communities, Jonathan Stray
- The network of global corporate control, Vitali et. al.
- The Dynamics of Protest Recruitment through an Online Network, Sandra González-Bailón, et al.
- Exploring Enron, Jeffrey Heer
Examples of journalistic network analysis
- Galleon’s Web, Wall Street Journal
- Muckety
- Theyrule.net,
- Who Runs Hong Kong?, South China Morning Post
Week 10: Drawing conclusions from data
You’ve loaded up all the data. You’ve run the algorithms. You’ve completed your analysis. But how do you know that you are right? It’s incredibly easy to fool yourself, but fortunately, there is a long history of fields grappling with the problem of determining truth in the face of uncertainty, from statistics to intelligence analysis.
Required
- basic stats concepts?
- Correlation and causation, Business Insider
- The Psychology of Intelligence Analysis, chapters 1,2,3 and 8. Richards J. Heuer
Recommended
- If correlation doesn’t imply causation, then what does?, Michael Nielsen
- Graphical Inference for Infovis, Hadley Wickham et al.
- Why most published research findings are false, John P. A. Ioannidis
Week 11: Security, Surveillance, and Censorship
intro to crypto?
‘On the internet everyone knows you are a dog’. Both in commercial and editorial terms the issues of online privacy, identity and surveillance and important for journalism. Who is watching our online works? How do you protect a source in the 21st Century? Who gets to access to all of this mass intelligence, and what does the ability to survey everything all the time mean both practically and ethically for journalism?
Required
- Chris Soghoian, Why secrets aren’t safe with journalists, New York times 2011
- Hearst New Media Lecture 2012, Rebecca MacKinnon
Recommended
- CPJ journalist security guide section 3, Information Security
- Global Internet Filtering Map, Open Net Initiative
- The NSA is building the country’s biggest spy center, James Banford, Wired
Cryptographic security
Anonymity
- Tor Project Overview
- Who is harmed by a real-names policy, Geek Feminism
Assignment: Come up with situation in which a source and a journalist need to collaborate to keep a secret. Describe in detail:
- The threat model. What are the risks?
- The adversary model. Who must the information be kept secret from? What are their capabilities, interests, and costs?
- A plan to keep the information secure, including tools and practices
- An evaluation of the costs, possible sources of failure, and remaining risks
Week 12: Tracking flow and impact
How does information flow in the online ecosystem? What happens to a story after it’s published? How do items spread through social networks? We’re just beginning to be able to track ideas as they move through the network, by combining techniques from social network analysis and bioinformatics.
Required
- Metrics, Metrics everywhere: Can we measure the impact of journalism?, Jonathan Stray
- Meme-tracking and the Dynamics of the News Cycle, Leskovec et al.
- The role of social networks in information diffusion, Eytan Bakshy et al.
Recommended
- Defining Moments in Risk Communication Research: 1996–2005, Katherine McComas
- Chain Letters and Evolutionary Histories, Charles H. Bennett, Ming Li and Bin Ma
- Competition among memes in a world with limited attention, Weng et al.
- Zach Seward, In the news cycle, memes spread more like a heartbeat than a virus
- How hidden networks orchestrated Stop Kony 2012, Gilad Lotan
Week 13 – Project review
We will spend this week discussing your final projects and figuring out the best approaches to your data and/or topic.
Week 14
Review of course. Invited guest panel of computer scientists working both within journalism and in related fields concerned with public information, discuss their priorities and answer questions about what their priorities.