Sadly, we had to cut this lecture short because of Hurricane Sandy, but I’m posting the slides and a few notes.
You have no doubt seen lots of visualizations recently, and probably even studied them in your other classes (such as Data Journalism.) I want to give you a bit of a different perspective here, coming more from the information visualization (“infovis”) tradition which goes back to the beginnings of computer graphics in the 1970s. That culture recognized very early the importance of studying the human perceptual system, that is, how our eyes and brains actually process visual information.
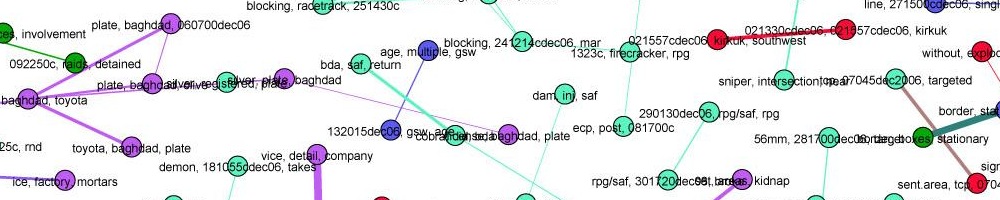
Take a look at the following image.

You saw the red line instantly, didn’t you? Importantly, you didn’t have to think about this, or go look at each line, one at a time to find it, you “just saw it.” That’s because your visual cortex can do many different types of pattern recognition at a pre-conscious level. It doesn’t take any time or feel like any effort for you. This particular effect is called “visual pop-out” and many different types of visual cues can cause it.

The human visual system can also do pre-conscious comparisons of things like length, angle, size and color. Again, you don’t have to think about it know which line is longer.

In fact, your eye and brain are sensitive to dozens of visual variables simultaneously. You can think of these as “channels” which can be used to encode quantitative information. But not all channels are equally good for all types of information. Position and size are the most sensitive channels for continuous variables, while color and texture aren’t great for continuous variables but work well for categorical variables. The following chart, from Munzer, is a summary of decades of perceptual experiments.

This consideration of what the human visual system is good at — and there’s lot’s more — leads to what I call the fundamental principle of visualization: turn something you want to find into something you can see without thinking about.
What kinds of “things” can we see in a visualization? That’s the art of visualization design! We’re trying to plot the data such that the features we are interested in are obviously visible. But here are some common data features that we can visualize.

The rest of the lecture — which we were not able to cover — gets into designing visualizations for big data. The key principle is, don’t try to show everything at once. You can’t anyway. Instead, use interactivity to allow the user to explore different aspects of the data. In this I am following the sage advice of Ben Fry’s Computational Information Design approach, and also drawing parallels to how human perception works. After all, we don’t “see” the entire environment at once, because only the central 2 degrees of our retina are sharp (the fovea.) Instead we move our eyes rapidly to survey our environment. Scanning through big data should be like this, because we’re already built to understand the world that way.
In the final part of the lecture — which we actually did cover, briefly — we discussed narrative, rhetoric and interpretation of visualizations. Different visualizations of the same data can “say” completely different things. We looked at a simple line graph and asked, what are all the editorial choices that went into creating it?

I can see a half dozen choices here; there are probably more.
- The normalization used — all values are adjusted relative to Jan 2005 values
- Choice of line chart (instead of any other kind)
- Choice of color. Should thefts be blue, or would red have been better?
- Time range. The data probably go back farther.
- Legend design.
- Choice of these data at all, as opposed to any other way to understand bicycle use and thefts.
Also, no completed visualization is entirely about the data. If you look at the best visualization work, you will see there there are “layers” to it. These include:
- The data. What data is chosen, what is omitted, what are the sources.
- Visual representation. How is the data turned into a picture.
- Annotation. Highlighting, text explanations, notes, legends.
- Interactivity. Order of presentation, what the user can alter.
In short, visualization is not simply a technical process of turning data into a picture. There are many narrative and editorial choices, and the result will be interpreted by the human perceptual system. The name of the game is getting a particular impression into the user’s head, and to do that, you have to a) choose what you want to say and b) understand the communication and perception processes at work.
Readings for this week were:
- Visual Encoding, Michael Dubakov
- Computational Information Design chapters 1 and 2, Ben Fry
- Journalism in an age of data, Geoff McGhee (an hour long documentary!)
- Visualization Rhetoric: Framing Effects in Narrative Visualization, Hullman and Diakopolous
- Visualization, Tamara Munzner
I also recommend the book Designing Data Visualizations.