This is the first of three weeks on “filtering.” We define that word by looking at a feedback model of journalism: a journalist observes something happening in the world, produces a story about it, the user consumes the story, and then they potentially act in some way that changes the world (such as voting, choosing one product over another, protesting, or many other possible outcomes.) This follows David Bornstein’s comment that “journalism is a feedback mechanism to help society self-correct.”
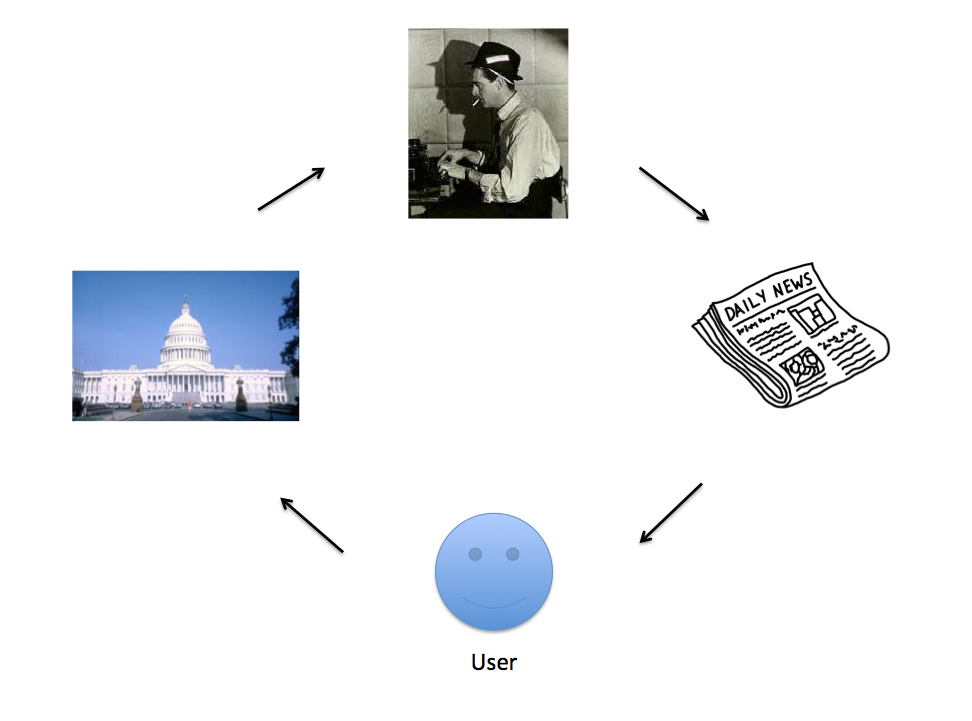
This diagram is missing something obvious: there are lots and lots of topics in the world, hence many stories. Not every potential story is written, and not every written story is consumed by every user.
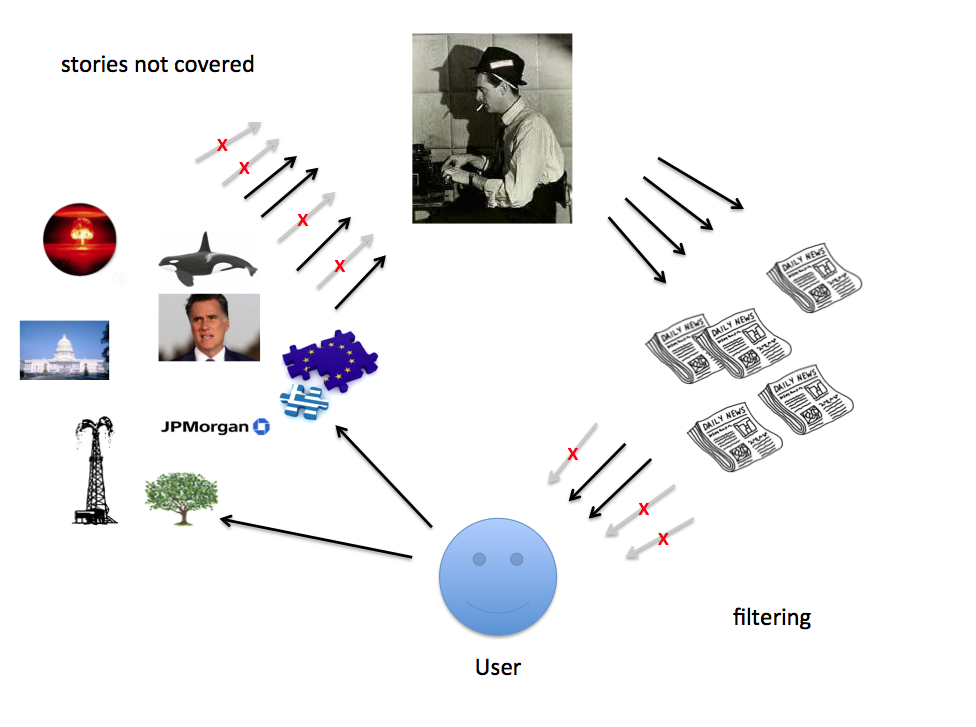
This is where “filtering” comes in, the arrow on the bottom right. Somehow, the user sees only a subset of all produced stories. The sheer, overwhelming logic of the amount of journalism produced versus hours in the day requires this (and we illustrated this with some numerical examples in the slides.)
(Incidentally, journalism as an industry has mostly been involved with story production, the upper-right arrow, and more recently has been very concerned about how fewer reporters result in more stories not covered, the upper left arrow. The profession has, historically, payed much less attention to the effects of its work, bottom left, and the filtering problem, bottom right.)
(There is another major thing missing from this diagram: users now often have access to the same sources as journalists, and in any case journalism is now deeply participatory. We’ll talk a lot more about this next week.)
This week we focussed on purely algorithmic filtering. As a concrete example, we examined the inner workings of the Columbia Newsblaster system, a predecessor of Google News which is conveniently well documented.
The readings (from the syllabus) were mostly to get you thinking about the general problem of information overload and algorithmic filtering, but the Newsblaster paper is also in there.
- Who should see what when? Three design principles for personalized news Jonathan Stray
- Tracking and summarizing news on a daily basis with Columbia Newsblaster, McKeown et al
- Guess what? Automated news doesn’t quite work, Gabe Rivera
- The Hermeneutics of Screwing Around, or What You Do With a Million Books, Stephen Ramsay
- Can an algorithm be wrong?, Tarleton Gillespie
- The Netflix Prize, Wikipedia
Actually, much of the guts of Newsblaster is in this paper on their on-line clustering algorithm that groups together all stories which are about the same underlying event. Note the heavy reliance on our good friends from last week: TF-IDF and cosine distance. The graphs in this paper show that for this problem, you can do better than TF-IDF by adding features corresponding to extracted entities (people, places, dates) but really not by very much.
We wrapped up with a discussion about the problem of algorithmic filter design. We defined this problem on two levels. In terms of functional form,
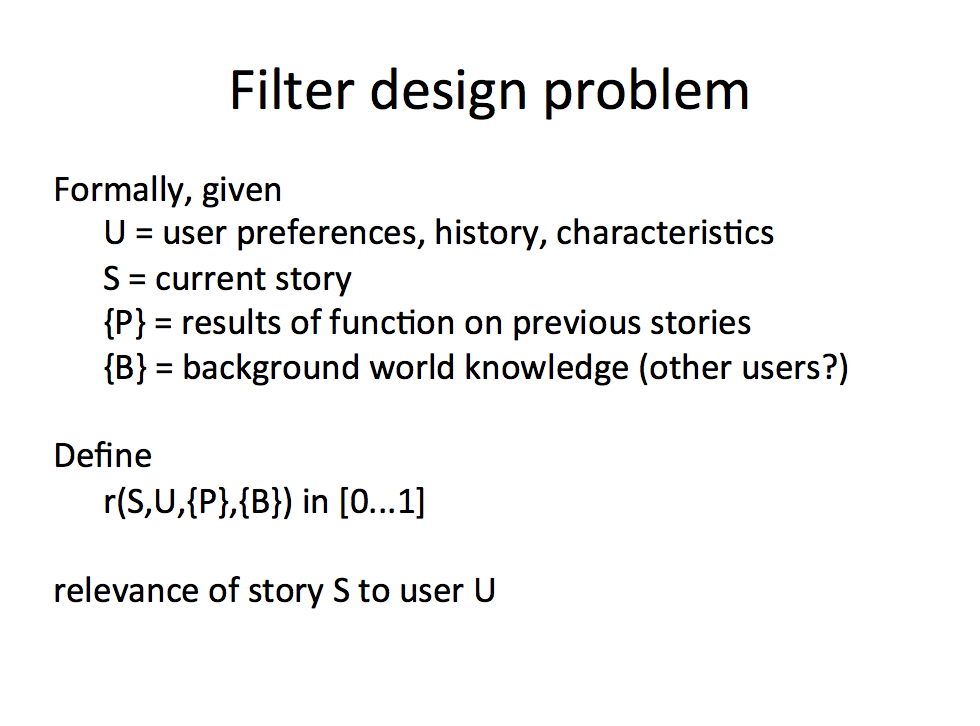
and in terms of the much more abstract desirable attributes
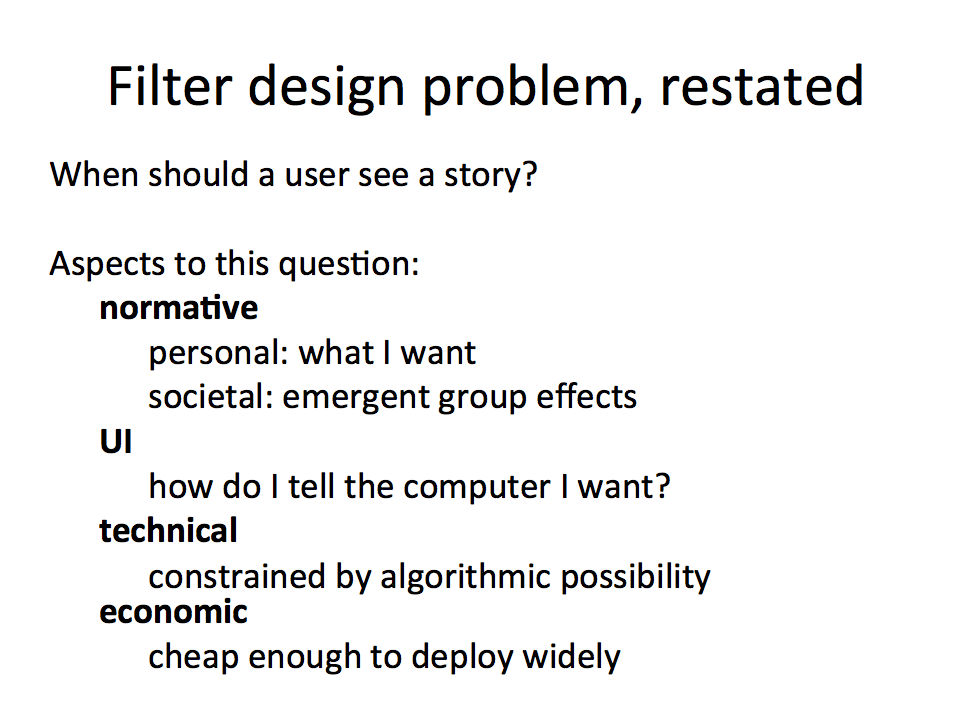 The great challenge is to connect these two levels of description: to express our design criteria in terms of an algorithm. Here are the notes from our brief discussion about how to do this.
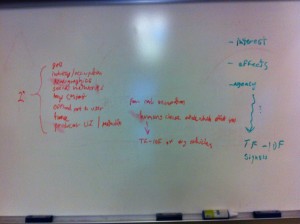
On the right we have interest, effects, agency, my proposed three criteria for “when should a user see a story.” Somehow, these have to be expressed in terms of computational building blocks like TF-IDF and all of the various signals available to the algorithm. That’s what the fuzzy arrow is… there’s a gap here, and it’s a huge gap.
On the left are some of the factors to consider in trying to assess whether a particular story is interesting, will effect, or can be acted on by a particular user: geo information (location of user and story), user’s industry and occupation, other user demographics, the people in the user’s social network, the “content” they’ve produced (everything they’ve ever tweeted, blogged, etc.), and the time or duration of the story event. We can also offload parts of the selection process to the user, by showing multiple stories or types of stories and having the user pick. Similarly we can offload parts of the problem to the story producer, who might use various techniques to try to target a particular story to a particular group of people. We’ll talk extensively about including humans in the filtering system in the next two weeks.
The bracket and 2^N notation just means that any combination of these factors might be relevant. E.g. location and occupation together might be a key criteria.
In the center of the board I recorded one important suggestion: we can use machine learning to teach the computer which are the right articles for each factor. For example, suppose we’re trying to have the algorithm decide which stories are about events that affect people in different occupations. For each occupation, a human can collect many stories that someone in that occupation would want to read, then we can take the average of the TF-IDF vectors of those stories to define a subject category. The computer can then compare each incoming story to the corresponding coordinate for each user’s occupation.
I don’t know whether this particular scheme will work, but having the humans teach the computers is an essential idea — and one that is very common in search engines and filtering systems of all kinds.