I’m altering the structure of the assignment a little bit from the version in the original syllabus, in the hopes of making it more interesting. We may even be able to learn and document somethings that seem to be missing from the literature.
The assignment goes like this:
1) Get your data into a standard format. You have all now chosen a dataset that contains, at least in part, a significant text corpus. Your first task will be to scrape, format, or otherwise coerce this information into a convenient format for Python to read.
I recommend a very simple format: plain text, one document per line, all documents in one file.
It’s not completely trivial to get the documents in this format, but it shouldn’t be hard either. The first task is to extract plain text from your documents. If your source material is PDF, you can use the pdftotext command (pre-installed on Macs, available for Windows and Linux as part of xpdf). If it’s HTML, you may want to delete matches to the regex /<[^>]*>/ to remove all tags; you may also want to scrape the content of a particular div, as opposed to the whole page source. If you need to scrape your data from web pages, I heartily recommend writing a little script within the ScraperWiki framework.
Obviously this one-document-per-line format can’t represent the newlines in the original document, but that’s ok, because we’re going to throw them out during tokenization anyway. So you can just replace them with spaces.
2) Feed the data into gensim. Now you need to load the documents into Python and feed them into the gensim package to generate tf-idf weighted document vectors. Check out the gensim example code here. You will need to go through the file twice: once to generate the dictionary (the code snippet starting with “collect statistics about all tokens”) and then again to convert each document to what gensim calls the bag-of-words representation, which is un-normalized term frequency (the code snippet starting with “class MyCorpus(object)”
Note that there is implicitly another step here, which is to tokenize the document text into individual word features — not as straightforward in practice as it seems at first, but the example code just does the simplest, stupidest thing, which is to lowercase the string and split on spaces. You may want to use a better stopword list, such as this one.
Once you have your Corpus object, tell gensim to generate tf-idf scores for you like so.
3) Do topic modeling. Now you can apply Latent Semantic Indexing or Latent Dirichlet Allocation to the tf-idf vectors, like so. You will have to supply the number of dimensions to keep. Figuring out a good number is part of the assignment. Note that you dont have to do topic modeling — this is really a dimensionality reduction / de-noising step, and depending on your documents and application, may not be needed. If you want to try working with the original tf-idf vectors, that’s OK too. That’s what Overview does.
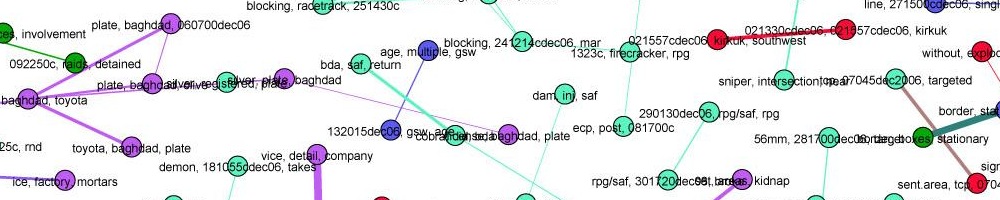
4) Analyze the vector space. So now you have a bunch of vectors in a space of some dimension, each of which represents a document, and we hope that similar documents are close in this space (as measured by cosine distance.) Have we gotten anywhere? There are several things we could do at this point:
- Choose particular document, then find the k closest documents. Are they related? How? (Read the text of the documents to find out) How big do you have to make k before you see documents that seem unrelated?
- Run a clustering algorithm, such as any of those in the python cluster package. Then look at the documents in each cluster, again reading their text and reporting on the results. Non-hierarchical clustering algorithms generally take the number of clusters as a parameter, while with hierarchical clusterings you have a choice of what level of the tree to examine. How do these choices affect what you see?
- Or, you could run multi-dimensional scaling to plot the entire space in 2D, perhaps with some other attribute (time? category?) as a color indicator variable. This is probably best done in R. To get your document vectors into R, write them out of gensim in the MatrixMarket format, then load them in R (remember you’ll need to do “library(Matrix)” first to make readMM available in R.) Then you’ll want to compute a distance matrix of the documents, run mdscale on it, and plot the result like we did in the House of Lords example.
- If you did LSI or LDA topic modeling, what do the extracted topics look like? Do they make any sort of human sense? Can you see examples of polysemy or synonymy? If you pull out the k docs with the highest score on a particular topic, what do you find? How many documents have no clear primary topic? What do the low-order topics (far down the dimension list) look like? How many dimensions until it just seems like noise?
Your assignment is to do one of these things, whichever you think will be most interesting. You may also discover that it is hard to interpret the results without trying some of the other techniques. Actually, figuring out how, exactly, to evaluate the clustering is part of this assignment. Hint: one useful idea is to ask, how might a human reporter organize your documents? Where did the computer go wrong?
You will of course need to implement cosine distance either in Python or R to make any of these go. This should be only a few lines…
5) Compare to a different algorithmic choice. Now do steps 3 and 4 again, with a different choice of algorithm or parameter. The point of this assignment is to learn how different types of clustering give qualitatively different results on your document set… or not. So repeat the analysis, using either:
- a different topic modeling algorithm. If you used plain tf-idf before, try LSI or LDA. Or if you tried LSI, try LDA. Etc.
- a different number of clusters, or a different level in the hierarchical clustering tree.
- a different number of output dimensions to LSI or LDA.
- a different distance function
- etc.
I want to know which of your two cases gives “better” results. What does “better” mean? It depends very much on what the interesting questions are for your data set. Again, part of the assignment is coming up with criteria to evaluate these clusterings. Generally, more or easier insight is better. (If the computer isn’t making your reporting or filtering task significantly easier, why use it?)
6) Write up the whole thing. I will ask you to turn in your the code you wrote but that’s really only to confirm that you actually did all the steps. I am far more interested in what you have learned about the best way to use these algorithms on your data set. Or if you feel you’ve gained little or no insight into your data set using these techniques, explain why, and suggest other ways to explore it.
This assignment is due Monday, October 15 at 4:00 PM. You may email me the results. I am available for questions by email before then, or in person at office hours on Thursday afternoons 1-4.