The course is a hands-on introduction to the areas of computer science that have a direct relevance to journalism, and the broader project of producing an informed and engaged public. We will touch on many different technical and social topics: information recommendation systems but also filter bubbles, principles of statistical analysis but also the human processes which generate data, network analysis and its role in investigative journalism, visualization techniques and the cognitive effects involved in viewing a visualization. Assignments will require programming in Python, but the emphasis will be on clearly articulating the connection between the algorithmic and the editorial.
Our scope is wide enough to include both relatively traditional journalistic work, such as computer-assisted investigative reporting, and the broader information systems that we all use every day to inform ourselves, such as search engines and social media. The course will provide students with a thorough understanding of how particular fields of computational research relate to journalism practice, and provoke ideas for their own research and projects.
Research-level computer science material will be discussed in class, but the emphasis will be on understanding the capabilities and limitations of this technology. Students with a CS background will have opportunity for algorithmic exploration and innovation, however the primary goal of the course is thoughtful, application-oriented research and design.
Format of the class, grading and assignments.
This is a fourteen week course for Masters’ students which has both a six point and a three point version. The six point version is designed for CS & journalism dual degree students, while the three point version is designed for those cross listing from other schools. The class is conducted in a seminar format. Assigned readings and computational techniques will form the basis of class discussion. The course will be graded as follows:
- Assignments: 80%. There will be a homework assignment after most classes.
- Class participation: 20%
Assignments will be completed in groups (except dual degree students, who will work individually) and involve experimentation with fundamental computational techniques. Some assignments will require intermediate level coding in Python, but the emphasis will be on thoughtful and critical analysis. As this is a journalism course, you will be expected to write clearly.
Dual degree students will also have a final project. This will be either a research paper, a computationally-driven story, or a software project. The class is conducted on pass/fail basis for journalism students, in line with the journalism school’s grading system. Students from other departments will receive a letter grade.
Week 1: Introduction and Clustering – 9/16
Slides
First we ask: where do computer science and journalism intersect? CS techniques can help journalism in four different areas: data-driven reporting, story presentation, information filtering, and effect tracking. Then we jump right into high dimensional data analysis and visualization, which we’ll need to study filtering, with an example of clustering, visualizing, and interpreting feature vectors of voting patterns.
Required
- What should the digital public sphere do?, Jonathan Stray
- Computational Journalism, Cohen, Turner, Hamilton
Recommended
- Precision Journalism, Ch.1, Journalism and the Scientific Tradition, Philip Meyer
Viewed in class
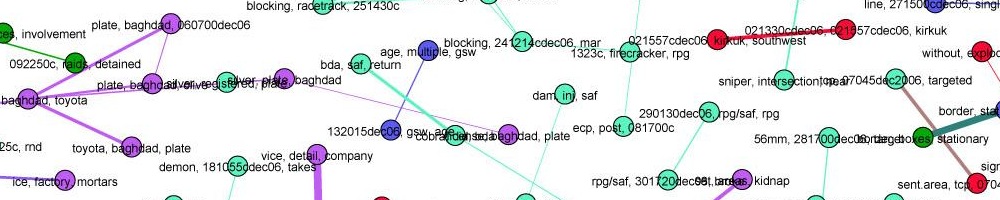
- What did private security contractors do in Iraq and document mining methodology, Jonathan Stray
- The Jobless rate for People Like You, New York Times
- Surgeon Scorecard, ProPublica
- Message Machine, ProPublica
- Using clustering to analyze the voting blocs in the UK House of Lords
Unit 1: Filtering
Week 2: Text Analysis – 9/23
Slides
Can we use machines to help us understand text? In this class we will cover basic text analysis techniques, from word counting to topic modeling. The algorithms we will discuss this week are used in just about everything: search engines, document set visualization, figuring out when two different articles are about the same story, finding trending topics. The vector space document model is fundamental to algorithmic handling of news content, and we will need it to understand how just about every filtering and personalization system works.
Required
- TF-IDF is about what matters, Aaron Schumacher
- Topic modeling by hand, Shawn Graham
- How ProPublica’s Message Machine reverse engineers political microtargeting, Jeff Larson
Recommended
- A full-text visualization of the Iraq war logs, Jonathan Stray
- Introduction to Information Retrieval Chapter 6, Scoring, Term Weighting, and The Vector Space Model, Manning, Raghavan, and Schütze.
- Probabilistic Topic Models, David M. Blei
Examples
- Watchwords: Reading China Through its Party Vocabulary, Qian Gang
Assignment: LDA analysis of State of the Union speeches.
Week 3: Filtering algorithms
Slides
This week we begin our study of filtering with some basic ideas about its role in journalism. We will study the details of several algorithmic filtering approaches including Twitter, Reddit’s comment ranking, the Newsblaster system (similar to Google News) and the New York Times recommendation engine.
Required
- Building the Next New York Times Recommendation Engine, Alexander Spangher
- Tracking and summarizing news on a daily basis with Columbia Newsblaster, McKeown et al
Recommended
- Matrix Factorization Techniques for Recommender Systems, Koren et al
- How Reddit Ranking Algorithms Work, Amir Salihefendic
- Google News Personalization: Scalable Online Collaborative Filtering, Das et al
- The Hermeneutics of Screwing Around, or What You Do With a Million Books, Stephen Ramsay
Discussed in class
- Item-Based Collaborative Filtering Recommendation Algorithms, Sarwar et. al
Week 4: Filters as Editors
Slides
We’ve seen what filtering algorithms do, but what should they do? This week we’ll study the social effects of filtering system design, how Google Search and other systems are optimized in practice, and start to ask about possible ill effects like polarization and fake news.
Required
- How Facebook’s Foray into Automated News Went from Messy to Disastrous, Will Oremus
- Who should see what when? Three design principles for personalized news Jonathan Stray
Recommended
- How does Google use human raters in web search?, Matt Cutts
- A Group is its own worst enemy, Clay Shirky
- What Happens to #Ferguson Affects Ferguson: Net Neutrality, Algorithmic Filtering and Ferguson, Zeynep Tufekci
- Guess what? Automated news doesn’t quite work, Gabe Rivera
- Can an algorithm be wrong?, Tarleton Gillespie
Viewed in class
- Israel, Gaza, War & Data: social networks and the art of personalizing propaganda, Gilad Lotan
- Learning from Stackoverflow, first fifteen minutes, Joel Spolsky
- What is Twitter, a Social Network or a News Media?, Haewoon Kwak, et al,
Assignment – Design a filtering algorithm for an information source of your choosing
Unit 2: Interpreting Data
Week 5: Quantification, Counting, and Statistics
Slides
Every journalist needs a basic grasp of statistics. Not t-tests and all of that, but more grounded. Where does data come from at all? How do we know we’re measuring the right thing, and measuring it properly? Then a solid understanding of the concepts that come up most in journalism: relative risk, conditional probability, the regressions and control variables, the use of statistical models generally. Finally, the state of the art in data-driven tests for discrimination.
- The Curious Journalist’s Guide to Data: Quantification, Jonathan Stray
- Testing for Racial Discrimination in Police Searches of Motor Vehicles, Simoiu et al
Recommended
- Why Not to Trust Statistics, Ben Orlin
- Statistics for Decision Makers: Base Rate Fallacy, Bernard Szlachta
- The Quartz Guide to Bad Data, Christopher Groskopf
- Solve Every Statistics Problem with One Weird Trick, Jonathan Stray
- Operationalizing, or the function of measurement in modern literary theory, Franco Moretti
- The Curious Journalist’s Guide to Data: Prediction, Jonathan Stray
Week 6: Drawing conclusions from data
Slides
This week is all about using data to report on ambiguous, complex, charged issues. It’s incredibly easy to fool yourself, but fortunately, there is a long history of fields grappling with the problem of determining truth in the face of uncertainty, from statistics to intelligence analysis. This week includes: statistical testing and statistical significance, Bayesianism in theory and practice, determining causality, p-hacking and reproducibility, analysis of competing hypothesis.
Required
- The Curious Journalist’s Guide to Data: Analysis, Jonathan Stray
- I Fooled Millions Into Thinking Chocolate Helps Weight Loss. Here’s How, John Bohannon,
Recommended
- Why most published research findings are false, John P. A. Ioannidis
- If correlation doesn’t imply causation, then what does?, Michael Nielsen
- The Psychology of Intelligence Analysis, chapter 8. Richards J. Heuer
- The Introductory Statistics Course: a Ptolemaic Curriculum, George W. Cobb
Viewed in class
- Science Isn’t Broken, Christie Aschwanden
- Correlation and causation, Business Insider
Assignment: Analyze NYPD stop and frisk data for racial discrimination. Details here.
Week 7: Algorithmic Accountability
Slides
Our society is woven together by algorithms. From high frequency trading to predictive policing, they regulate an increasing portion of our lives. But these algorithms are mostly secret, black boxes form our point of view. We’re at they’re mercy, unless we learn how to interrogate and critique algorithms. We’ll focus in depth on analysis of discrimination of various types, and how this might (or might not) be possible in computational journalism.
Required
- How Uber surge pricing really works, Nick Diakopoulos
- How Big Data is Unfair, Moritz Hardt
Recommended
- How the Journal Tested Prices and Deals Online, Jeremy Singer-Vine, Ashkan Soltani and Jennifer Valentino-DeVries
- How We Analyzed the COMPAS Recidivism Algorithm, Larson et al.
- Big Data’s Disparate Impact, Barocas and Selbst
- Algorithmic Accountability: On the investigation of black boxes, Nick Diakopoulos
- How Algorithms Shape our World, Kevin Slavin
Unit 3: Methods
Week 8: Visualization
Slides
An introduction into how visualization helps people interpret information. Design principles from user experience considerations, graphic design, and the study of the human visual system. The Overview document visualization system used in investigative journalism.
Required
- Visualization, Tamara Munzner
Recommended
- 39 Studies about Human Perception in 30 minutes, Kennedy Elliot
- Computational Information Design chapters 1 and 2, Ben Fry
- Overview: The Design, Adoption, and Analysis of a Visual Document Mining Tool For Investigative Journalists, Brehmer et al.
- Journalism in an age of data, Geoff McGhee
- Visualization Rhetoric: Framing Effects in Narrative Visualization, Hullman and Diakopolous
Week 9: Knowledge representation
Slides
How can journalism benefit from encoding knowledge in some formal system? Is journalism in the media business or the data business? And could we use knowledge bases and inferential engines to do journalism better? This gets us deep into the issue of how knowledge is represented in a computer. We’ll look at traditional databases vs. linked data and graph databases, entity and relation detection from unstructured text, and traditional both probabilistic and propositional formalisms. Plus: NLP in investigative journalism, automated fact checking, and more.
Required
- What do journalists do with documents? Jonathan Stray
- Relation extraction and scoring in DeepQA – Wang et al, IBM
Recommended
- A fundamental way newspaper websites need to change, Adrian Holovaty
- The State of Automated Fact Checking, Full Fact
- Storylines as Data in BBC News, Jeremy Tarling
- Building Watson: an overview of the DeepQA project
- Automation in the newsroom, Celeste LeCompte.
Viewed in class
- The next web of open, linked data – Tim Berners-Lee TED talk
- https://schema.org/NewsArticle
- Connected China, Reuters/Fathom
Assignment: Text enrichment experiments using StanfordNER entity extraction.
Week 10: Network analysis
Slides
Network analysis (aka social network analysis, link analysis) is a promising and popular technique for uncovering relationships between diverse individuals and organizations. It is widely used in intelligence and law enforcement, but not so much in journalism. We’ll look at basic techniques and algorithms and try to understand the promise — and the many practical problems.
Required
- Analyzing the Data Behind Skin and Bone, ICIJ
- Simmelian Backbones: Amplifying Hidden Homophily in Facebook Networks. A soophisticated and sociologically-aware network analysis method.
Recommended
- Visualizing Communities, Jonathan Stray
- Identifying the Community Power Structure, an old handbook for community development workers about figuring out who is influential by very manual processes.
- The network of global corporate control, Vitali et. al.
- The Dynamics of Protest Recruitment through an Online Network, Sandra González-Bailón, et al.
- Sections I and II of Community Detection in Graphs, Fortunato
- Centrality and Network Flow, Borgatti
- Exploring Enron, Jeffrey Heer
Examples:
- Galleon’s Web, Wall Street Journal
- Muckety
- Theyrule.net,
- Who Runs Hong Kong?, South China Morning Post
Assignment: Compare different centrality metrics in Gephi.
Week 11: Privacy, Security, and Censorship
Slides
Who is watching our online activities? How do you protect a source in the 21st Century? Who gets to access to all of this mass intelligence, and what does the ability to survey everything all the time mean both practically and ethically for journalism? In this lecture we will talk about who is watching and how, and how to create a security plan using threat modeling.
Required
- Digital Security for Journalists, Part 1 and Part 2, Jonathan Stray
- Hearst New Media Lecture 2012, Rebecca MacKinnon
Recommended
- CPJ journalist security guide section 3, Information Security
- Global Internet Filtering Map, Open Net Initiative
- Unplugged: The Show part 9: Public Key Cryptography
- Diffe-Hellman key exchange, ArtOfTheProblem
- Tor Project Overview
- Who is harmed by a real-names policy, Geek Feminism
Assignment: Use threat modeling to come up with a security plan for a given scenario.
Week 12: Tracking flow and impact
How does information flow in the online ecosystem? What happens to a story after it’s published? How do items spread through social networks? We’re just beginning to be able to track ideas as they move through the network, by combining techniques from social network analysis and bioinformatics.
Required
- Metrics, Metrics everywhere: Can we measure the impact of journalism?, Jonathan Stray
- Meme-tracking and the Dynamics of the News Cycle, Leskovec et al.
- How promotion affects pageviews on the New York Times website, Brian Abelson
Recommended
- NewsLynx: A Tool for Newsroom Impact Measurement, Michael Keller, Brian Abelson
- The role of social networks in information diffusion, Eytan Bakshy et al.
- Defining Moments in Risk Communication Research: 1996–2005, Katherine McComas
- Chain Letters and Evolutionary Histories, Charles H. Bennett, Ming Li and Bin Ma
- Competition among memes in a world with limited attention, Weng et al.
- Zach Seward, In the news cycle, memes spread more like a heartbeat than a virus
- How hidden networks orchestrated Stop Kony 2012, Gilad Lotan
Final projects due 12/31 (dual degree Journalism/CS students only)